
AI agent observability is the practice of capturing enough structured evidence about each agent run (the request, every model call, every tool call, the retrieved context and the final outcome) that an engineer can reconstruct why the agent did what it did. Infrastructure metrics tell you that a service is slow or failing. Agent observability tells you why a run chose the wrong tool, retrieved the wrong document, or looped for forty steps before giving up.
This guide covers what to instrument, how to read multi-agent traces, which metrics deserve alerts, when plain logging is enough, and how to keep traces from becoming a data-protection liability.
TL;DR
- Agent observability extends monitoring from service health to decision paths: it records reasoning steps, tool calls, retrieved context, state changes and outcomes in order, per session.
- Trace the whole session, not just single model calls. Multi-step sessions with tool handoffs and retrieval are where most agent failures live.
- Pair tracing with evaluation and with service-level objectives on latency, cost and quality scores, so regressions page someone before users notice.
- Treat traces as sensitive data: redact prompts, scope access, and keep an audit trail for consequential actions separate from debug logs.
- Standardize on OpenTelemetry-style span names so traces survive a change of model, harness or backend.
What AI agent observability covers
Traditional application monitoring answers a narrow question: is the system healthy? It watches CPU, error rates, request latency and saturation. An agent can pass every one of those checks while producing a wrong answer, because the failure is in the decision, not in the infrastructure. One analysis from a machine learning tooling vendor frames the shift as moving from infrastructure health toward understanding the reasoning and intent behind agent decisions.
It also differs from LLM observability. LLM observability is scoped to individual model calls: prompt, completion, tokens, latency. Agent observability has to span entire multi-step sessions, including tool handoffs and retrieval, because the unit of failure is the run, not the call. A broader definition from an infrastructure monitoring vendor describes AI observability as visibility into how models, prompts, retrieval systems, tools and infrastructure behave together in production, which is the right mental model: the agent is a system, and the model is one component.
| Dimension | Traditional monitoring | LLM observability | Agent observability |
|---|---|---|---|
| Unit of analysis | Request or host | Single model call | Full session or run |
| Typical signals | Latency, errors, saturation | Tokens, latency, completion quality | Tool calls, retrieved context, state changes, handoffs, outcome |
| Failure it explains | Outages, slow endpoints | Bad completions, cost spikes | Wrong tool choice, loops, stale context, silent task failure |
| Who reads it | SRE | ML engineer | Engineer, product owner, auditor |
Why teams need it in development and in production
In development, the argument is speed. Without a trace, debugging an agent means rerunning it and hoping the failure repeats. With one, you open the run and see the step where the plan diverged. A continuous feedback loop that combines tracing and evaluation is described as central to shipping AI changes with confidence: you change a prompt, a model or a harness, replay representative runs, and compare scores before release.
In production, the argument is accountability. When agents handle sensitive data, observability helps an organization demonstrate how those decisions were made. It also solves a visibility problem that grows with adoption: agents that run in an enterprise without being registered or connected to any platform. A 2026 enterprise strategy piece calls this the "Hubble Deep Field Problem" and argues that observability should connect the original assignment to the agent's path and the business outcome.
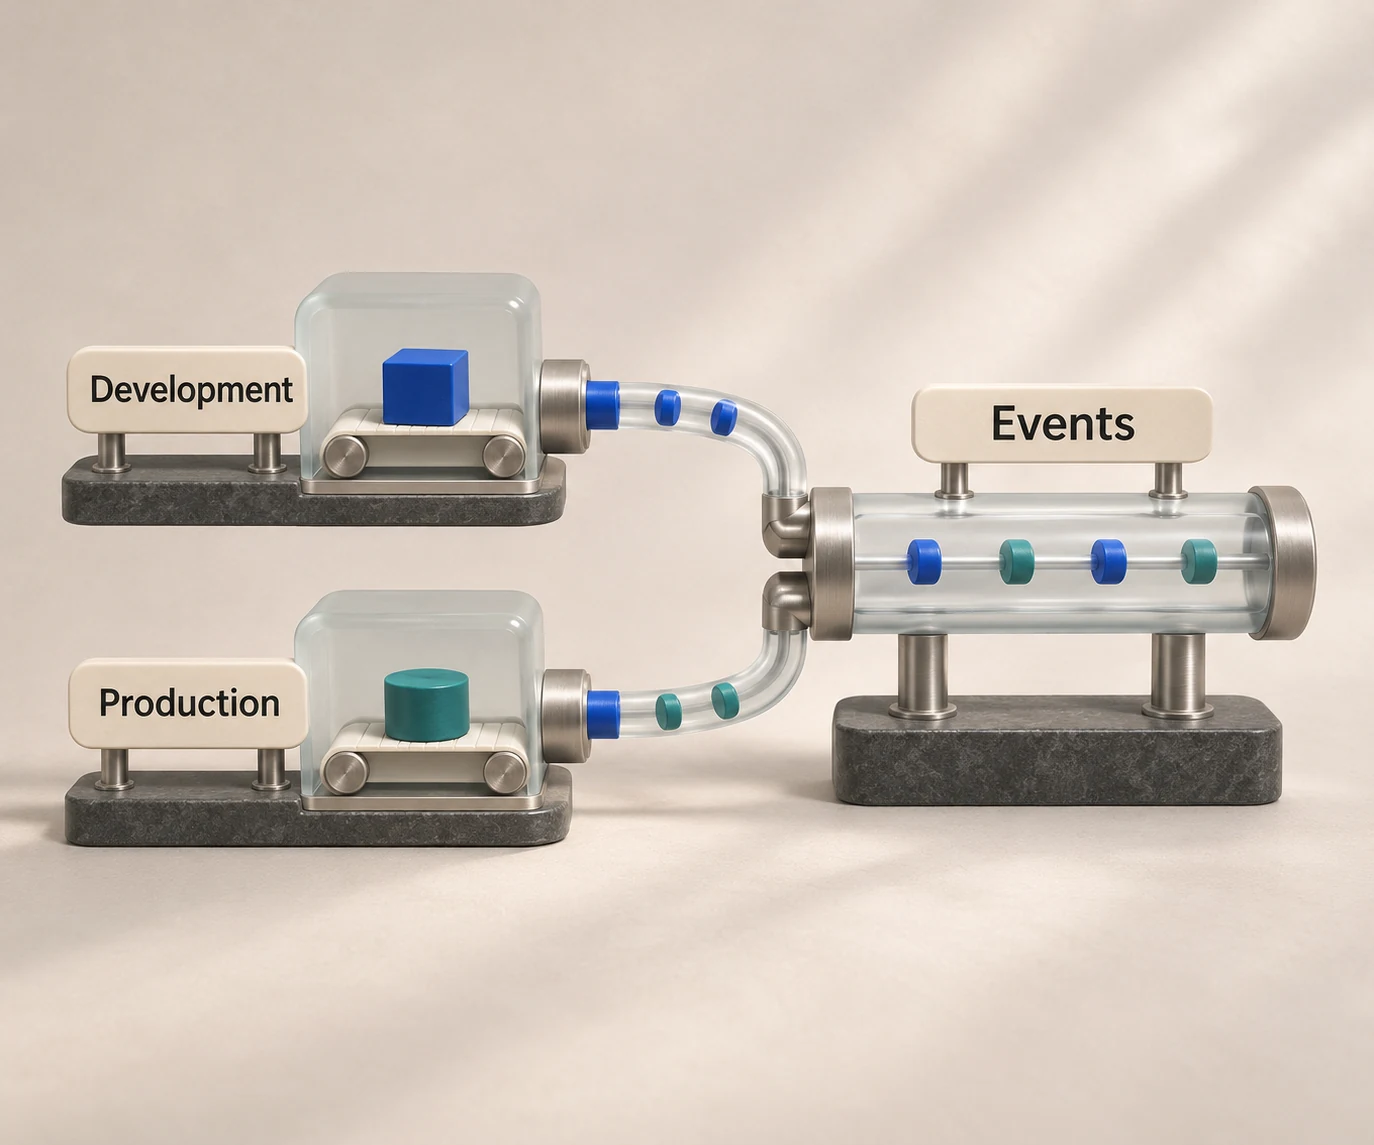
The practical consequence is that observability should be designed in at the integration layer, not bolted on per agent. If every agent is reached through one API and one session model, every run is traceable by default. That is a design principle behind a complete backend for AI agents: sessions, files, environments and lifecycle events live in one place, so telemetry has one place to originate.
What to trace in every run
A useful trace preserves order and context. The guidance most teams converge on is to record the user request, model calls, retrieved context, tool calls and their results, state changes, handoffs and the confirmed outcome, with each item linked to its parent step. Concretely:
- The originating request. Store the user input, the identity or tenant it came from, and the session identifier. Everything else hangs off this.
- Model calls. Model name and version, parameters, token counts, latency, and the prompt and completion (subject to the redaction rules below).
- Retrieved context. What was fetched, from which index or source, with what ranking score. Many wrong answers trace to a correct model reading the wrong document.
- Tool calls and results. Tool name, arguments, return value, duration and error state. Record denied or failed attempts as well as successful ones.
- State changes. Files written, records modified, memory updated, environment changes inside a sandbox.
- Handoffs. When one agent or harness passes work to another, log who passed what to whom.
- The confirmed outcome. Not "the model stopped" but "the task was verified complete," by a test, a check or a human.
Use a standard span vocabulary
Instrumentation that uses a vendor-specific schema locks your traces to one backend. The OpenTelemetry project maintains semantic conventions for generative AI spans that define operations such as create_agent, invoke_agent and plan, alongside inference and retrieval spans. At the time of its latest revision these were marked as in development, so pin the version you adopt and expect attribute names to change.
The same document makes a point that matters for the privacy section below: model instructions, user messages and model outputs are considered sensitive and are often large, so recording them may be problematic because of storage cost and regulatory requirements. Make content capture a configurable switch, not a default.
Threads matter more than single traces
Agents are conversational and long-running. A single trace shows one run; a thread links the runs of one session so you can see how context accumulated and where the user rephrased because the last answer failed. Key your telemetry on a session identifier first and a trace identifier second.
Observing and debugging multi-agent workflows
Multi-agent systems multiply the ways a run can go wrong, because failure can originate in the coordination between agents rather than in any one of them. A workable approach has four parts.
One trace, many agents. Propagate a single trace context across every agent boundary, so a parent task, its delegated subtasks and their tool calls form one tree. If each agent starts a new trace, you will spend your debugging time stitching them together by timestamp.
Explicit handoff spans. Record each delegation as its own span containing the instruction sent, the context shared and the result returned. Most multi-agent bugs are information loss at this boundary: the child agent never received the constraint the parent considered obvious.
Role and harness labels. Tag every span with the agent role and the harness or runtime that executed it. When teams mix several agent harnesses behind one interface, this label is what lets you ask whether failures cluster on one runtime. Our guide to the seven layers of the AI agent stack shows where each of these concerns sits.
Replay before you theorize. Capture enough input (prompts, tool results, file state) to replay a failed run deterministically, or as close as the model allows. Then change one variable at a time: the model, the prompt, the tool description, the harness. Because agent portability lets the same task run on different harnesses, a replay on a second harness quickly separates a model problem from a runtime problem.
Protocols matter here too. When agents call tools and each other over standard protocols, the protocol messages themselves are a natural instrumentation point. We compare the options in AI agent protocols in 2026.
Metrics, evaluation and alerting
Traces explain individual runs. Metrics tell you whether the population of runs is healthy. LLM observability generally rests on three pillars: tracing, metrics aggregation and evaluation, where evaluation scores traces using code, an LLM acting as judge, or human review.
Metrics worth a dashboard
- Task success rate, defined by the confirmed outcome, not by the absence of an exception.
- Latency, as p50 and p95 per session and per step. Averages hide the long loops.
- Cost per run and per hour, broken down by model, tool and sandbox time.
- Steps per run, which is the cheapest early warning for loops.
- Tool error and retry rates, per tool.
- Evaluation scores, tracked over time per prompt and model version.
Set service-level objectives
One practitioner guide recommends defining service-level objectives and alerting on cost per hour, p95 latency and drops in evaluation quality scores. The pattern is sound regardless of source: pick two or three objectives that map to user experience, such as "95% of sessions complete within a set time" and "task success does not fall below an agreed floor," and page only when they are at risk. Alerting on every tool error produces noise that teaches the team to ignore pages.
Production reliability in regulated settings raises the bar further. For a view of how operational mistakes with AI agents play out in financial services, see mistakes banks make with AI agents.
Model benchmarking belongs in the same loop
Evaluation is not only for production regressions. The same scored runs let you compare harnesses and models on quality and price before you commit. HarnessRouter's own approach is to make that comparison quick, so the cheapest configuration that clears your quality bar can be chosen on evidence; our ranking of coding agents by task and evidence shows the method applied to one category.
When logging is enough, and when it is not
Not every agent needs a full observability stack on day one. A reasonable decision rule:
| Situation | Sufficient | Move up when |
|---|---|---|
| Prototype, one developer, single model call with no tools | Structured logs of prompt, response, latency and token count | You add a tool or a second step |
| Internal tool, a few tools, low stakes | Logs plus basic traces with tool arguments and results | Users report wrong answers you cannot reproduce |
| Customer-facing agent, multiple steps, retrieval | Full session traces, cost and latency metrics, sampled evaluation | Volume makes manual review impractical |
| Agent that changes records, moves money or touches sensitive data | Full traces, continuous evaluation, separate audit trail, access controls | Always, from the first release |
The boundary is the first moment you cannot explain a bad outcome from logs alone. At that point, you need ordered, linked, step-level evidence. Continuous evaluation becomes worthwhile when you change prompts, models or harnesses often enough that manual spot checks cannot catch regressions.
Privacy, security and audit trails
Traces contain prompts, retrieved documents and tool outputs, which makes them one of the most sensitive datasets in your system. The OpenTelemetry guidance cited above already flags message content as sensitive. The OWASP list of LLM risks also covers sensitive information disclosure, including credentials passed to a model surfacing through outputs, which is a reason to redact before anything reaches a trace store.
Practical controls:
- Redact at the source. Mask secrets, personal identifiers and API keys before spans are exported. Never log an API key, including a bring-your-own provider key.
- Make content capture opt-in. Default to metadata (names, sizes, durations, hashes) and enable full prompt and completion capture per environment.
- Scope access and retention. Limit who can read raw traces and set retention by data class.
- Track security signals. A September 2026 developer guide suggests security observability should cover prompt-injection detections, privileged tool attempts and cross-tenant retrieval attempts.
- Separate the audit trail. For actions with business or regulatory weight, such as moving money or changing records, practitioners recommend an audit trail distinct from debug logs. Debug logs are sampled, mutable and short-lived; an audit trail is complete, append-only and retained for a defined period. If your agents run code, isolating that execution is part of the same story; see AI agent sandboxing.
Retention periods and lawful bases for storing personal data depend on your jurisdiction and sector. Have your security or privacy counsel confirm them before you enable full content capture.
A rollout plan
- Define the outcome. Write down what "task completed" means for each agent in a form that code can check.
- Instrument the boundaries. Wrap model calls, tool calls, retrieval and handoffs with spans using a standard vocabulary.
- Key everything by session. Propagate session and trace identifiers across agents and harnesses.
- Add evaluation. Start with a small set of representative runs and a code-based check, then add model-based scoring where code cannot judge.
- Set two or three objectives. Alert on success rate, p95 latency and cost per hour.
- Lock down the data. Redaction, access control, retention and an audit trail for consequential actions.
- Close the loop. Every production failure becomes a test case in the evaluation set.
Perspective: observability starts at the integration layer
We build HarnessRouter on a simple observation: teams do not struggle to get an agent to work once. They struggle to keep it observable, comparable and replaceable as models and harnesses change monthly. When each agent runs behind its own backend, every one needs its own session store, file handling, sandbox and telemetry, and no two traces look alike.
Our answer is one Agent API in front of many harnesses, including Codex, Claude Code, Hermes and others, with agent sessions, files, plugins, environments and runtime lifecycle handled in one place. Our view is that this is the right foundation for observability: a single session model means a single place to attach traces, and the ability to run the same task on another harness turns debugging and benchmarking into the same activity.
We also believe the foundation should be open. The Community Edition is open source, and we support open standards such as the Unified Harness Protocol, so the telemetry and the workflow are yours rather than locked to a vendor.
Start with one API and one session model
If you are wiring several agent harnesses into a product, the cheapest time to get observability right is before each one has its own backend. HarnessRouter provides one Agent API for Codex, Claude Code, Hermes and other supported harnesses, with sessions, files, environments and benchmarking tools included, so you can compare quality and price on your own tasks.

As published on the pricing page, there is a Free plan at $0 per month, Developer at $20 per month, Production at $200 per month and Scale at $1,000 per month, plus an Enterprise plan without a published price. Tracing is listed as an add-on at $50 per month. If you prefer to run it yourself, the Community Edition is open source. You can also review the Claude Code harness or start from the [HarnessRouter home page](/).
FAQ
What is the difference between LLM observability and AI agent observability?
LLM observability looks at individual model calls: the prompt, the completion, tokens and latency. AI agent observability follows an entire multi-step session, including tool calls, retrieval and handoffs between agents. You need both, but only the second explains why a run with several individually acceptable calls still failed the task.
What tools do I need for LLM observability?
You need four capabilities: tracing with session grouping, metrics aggregation, evaluation using code, model-based or human scoring, and alerting on objectives. Choose instrumentation that follows OpenTelemetry-style conventions so you can change backends later. Whether those capabilities come from a commercial platform, an open-source stack or your existing monitoring system matters less than whether traces are linked by session.
Do I need observability for a simple agent prototype?
Not a full stack. Structured logs of prompts, responses, latency and token counts are enough while the agent makes a single call without tools. Add step-level tracing once the agent calls tools or retrieves data, and add evaluation once you change prompts or models regularly.
How do I keep traces from leaking sensitive data?
Redact secrets and personal identifiers before export, make full prompt and completion capture opt-in per environment, restrict access to raw traces and set retention by data class. For actions that move money or change records, keep a separate audit trail rather than relying on debug logs.
Sources
- Mastering AI agent observability
- What Is AI Agent Observability? A Practitioner Guide
- What Is AI Observability?
- Why observability is essential for AI agents
- Key enterprise strategies for AI agent observability
- Agent observability: how to trace, debug, and improve AI agents
- OpenTelemetry semantic conventions for generative AI spans
- LLM Observability in 2026: Tracing, Evals
- LLM Observability: A Developer's Guide
- Agent observability and audit trails for non-human workers
- LLM02:2025 Sensitive Information Disclosure