

0.47 credits, compared with 223 credits for the highest-cost configuration in this test.
HarnessRouter Benchmark 01
Same task. Eight configurations. About a 475× cost range.
HarnessRouter recorded the same controlled synthetic-data Care Prep task and input across Codex, Claude Code, and Hermes configurations. Measured cost ranged from 0.47 to 223 credits, while end-to-end latency ranged from 1m 25s to 4m 36s.
This is one controlled test, not a universal ranking. It is the first in a series of HarnessRouter benchmarks. We will publish more tasks, configurations, and evaluation methods over time.
- Configurations
- 8
- Measured cost range
- ≈475×
- Latency range
- 3.2×
Harness × model combinations
0.47 to 223 credits
1m 25s to 4m 36s
Results
Eight configurations, one task
Results are grouped by model so the effect of the harness remains visible. Lower cost and lower latency are better within this test.
| Harness | Model | End-to-end latency | Cost |
|---|---|---|---|
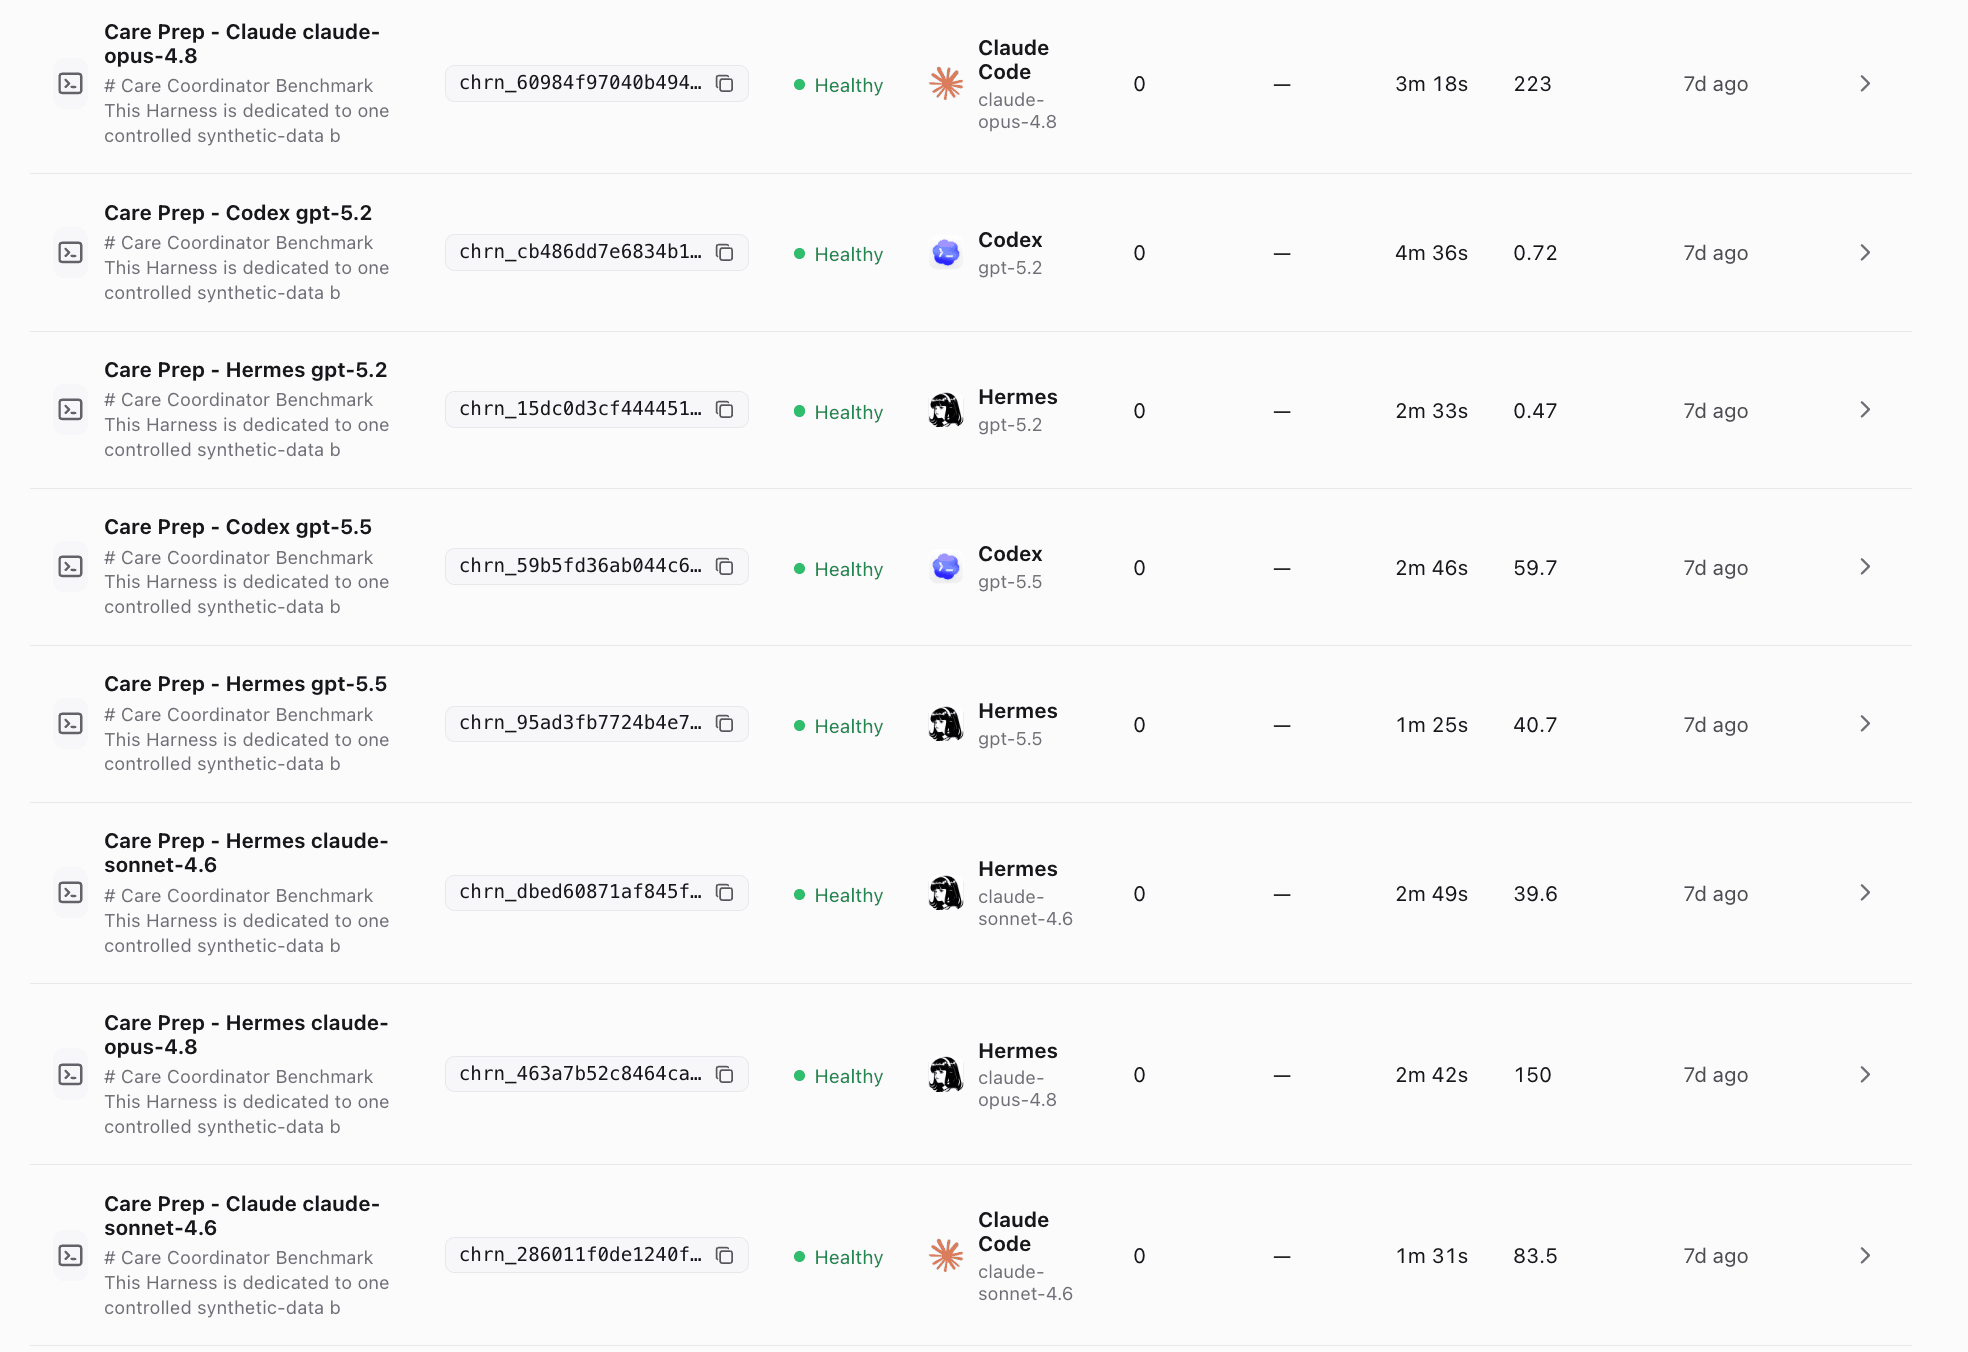
 Hermes Hermes | gpt-5.2 | 2m 33s | 0.47 credits |
 Codex Codex | gpt-5.2 | 4m 36s | 0.72 credits |
| Hermes | gpt-5.5 | 1m 25s | 40.7 credits |
| Codex | gpt-5.5 | 2m 46s | 59.7 credits |
| Hermes | claude-sonnet-4.6 | 2m 49s | 39.6 credits |
 Claude Code Claude Code | claude-sonnet-4.6 | 1m 31s | 83.5 credits |
| Hermes | claude-opus-4.8 | 2m 42s | 150 credits |
| Claude Code | claude-opus-4.8 | 3m 18s | 223 credits |
The approximately 475× figure compares 223 with 0.47 credits. Because the displayed measurements are rounded, the ratio is also approximate. The latency range is 276 ÷ 85, or approximately 3.2×. The lowest-cost configuration consumed 99.8% fewer credits than the highest-cost configuration.
What this test shows
The choice changes with the objective
A single popularity rank cannot answer which setup is right for a production workload. Cost and speed can move in different directions.
1m 25s end to end, compared with 4m 36s for the slowest configuration in this test.
Claude Code finished faster, while Hermes consumed fewer credits. The right choice depends on the workload objective.
For six of the eight configurations, another setup in this test was both cheaper and faster. Three out of four setups here had a strictly better alternative available.
With the model held constant, switching only the harness moved cost by 1.5x to 2.1x and end-to-end latency by up to 1.95x in this test.
Most of the 475x spread comes from model-tier economics; on the same model the harness multiplies cost by up to 2.1x. Both choices are parameters you can route on.
Recorded evidence
The source run capture
The result table above transcribes the eight configurations shown in this HarnessRouter capture.
Quality evaluation
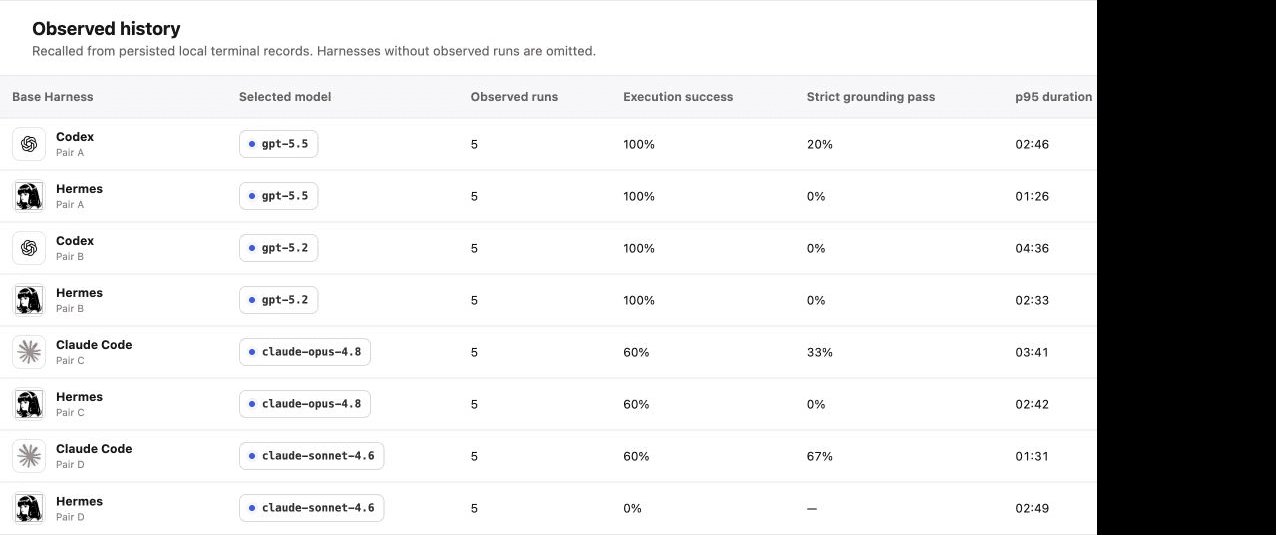
The same experiment also tested grounding.
Across the same eight configurations, the experiment retained 5 observed runs per configuration while keeping the dataset, task, Skill, schema, and output contract fixed.
Methodology
How to read these results
This publication is designed to make the measurement and its limits clear, not to declare one harness universally best.
- Test scope
- One controlled synthetic-data Care Prep experiment across eight harness and model configurations.
- Observed history
- The experiment retained 5 observed runs per configuration and applied an objective validator to completed outputs.
- Held constant
- The dataset, Task, Skill, schema, and output contract remained fixed across configurations.
- Changed
- The selected agent harness and model configuration changed between rows.
- Measurements
- The source capture records cost and end-to-end latency for each configuration. The observed history reports execution success, strict grounding pass rate, and p95 duration.
- Quality boundary
- This publication does not combine quality into one score. The objective validator reports specific grounding checks; safety and workflow usefulness remain separate human-review criteria.
- Interpretation
- These results apply to this task and configuration set. Results can change with the task, input, harness, model, environment, and configuration.
Your workload is the benchmark
Compare harnesses on the work your product actually runs.
HarnessRouter Cloud records execution traces across harness and model configurations so teams can compare cost, latency, and quality using their own production criteria.