
AI model benchmarking is the practice of running candidate models against the same tasks, under the same conditions, and comparing quality, latency, cost, and reliability. Public leaderboards are a sound way to build a shortlist, but they cannot choose the model for you: the decision has to rest on a task set drawn from your own product, run through a controlled harness, and scored on more than one axis. This guide explains what benchmarks measure, where they mislead, how to build a reproducible evaluation, and how the process changes when the thing under test is an agent rather than a bare model.
TL;DR
- Public benchmark scores describe performance on particular task types and may not predict how a model behaves in your product, so use them to shortlist and your own evaluation to decide.
- Build the evaluation set from production-like tasks that are defined, demonstrative, diverse, decontaminated, and dynamic, and keep updating it.
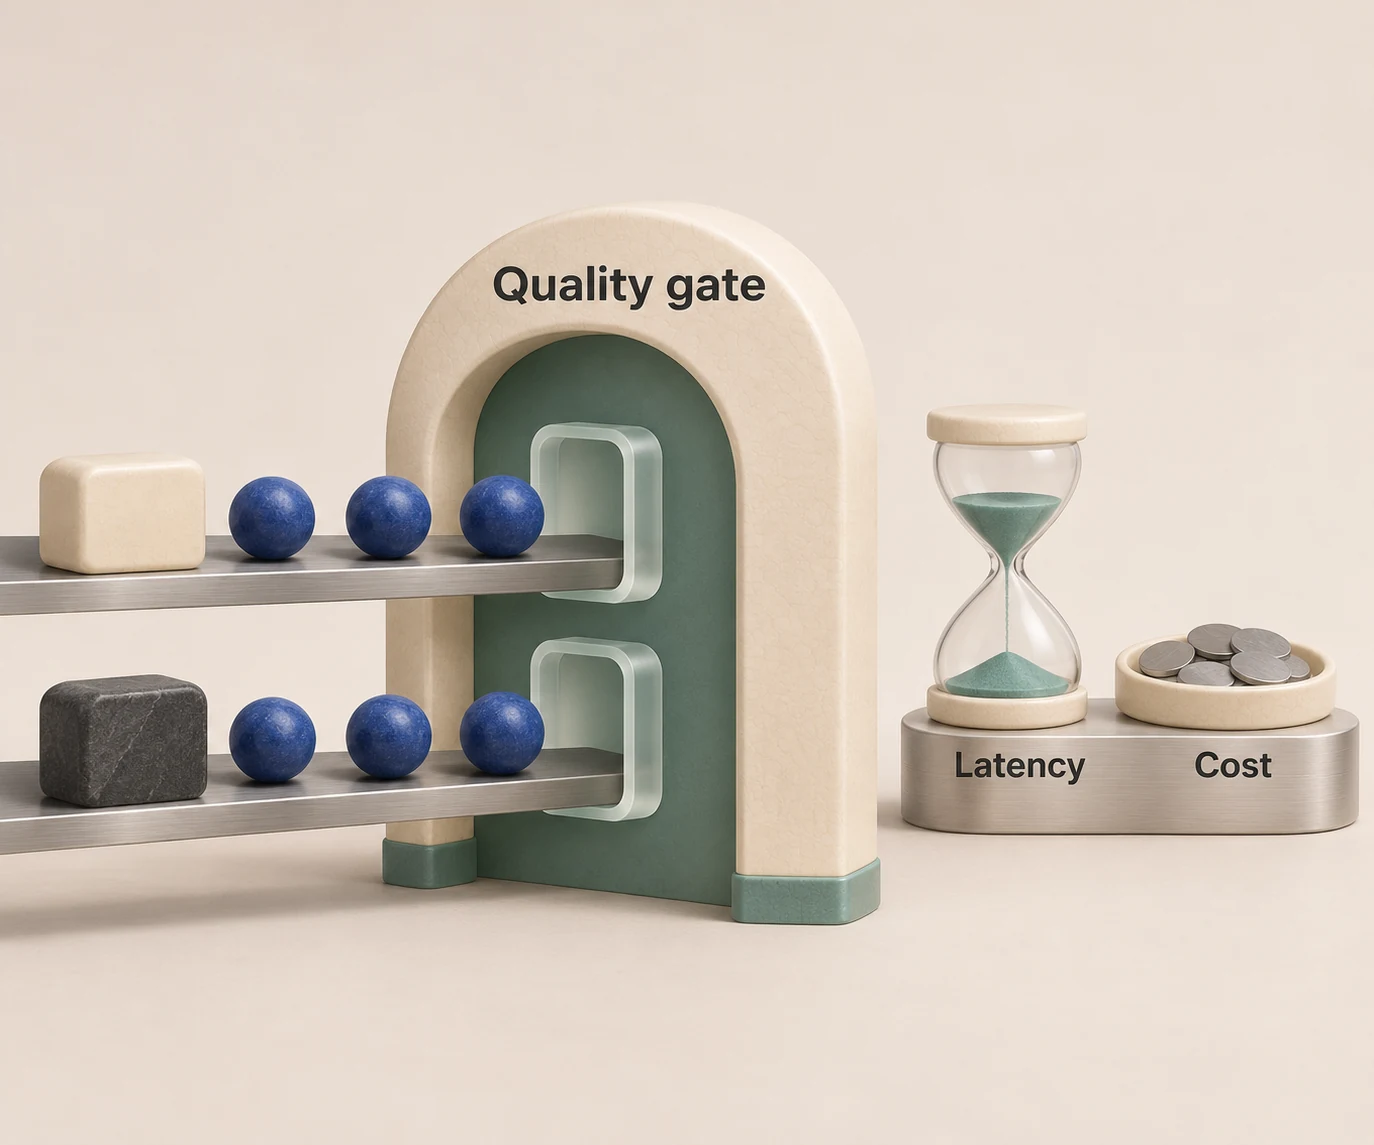
- Score quality, tail latency, and workload-weighted cost together; a single ranking hides trade-offs that reorder once your input-to-output ratio is applied.
- For agent products, the harness around the model (tools, sandbox, session handling) is part of what you are measuring, so hold it constant or benchmark it as a variable on purpose.
- Pin versions, fix sampling parameters, repeat runs, and log every trajectory so a result can be reproduced next quarter.
What AI model benchmarking actually measures
A benchmark is a fixed set of tasks with a scoring rule. Its score says how a model performed on that set, under that prompt format and that scoring method, at the time of the run. Research on the topic is direct about the limit of this: benchmarking assesses performance on particular task types, and public scores may not predict generalizable real-world competence because benchmark data can enter training, tasks can lack real-world relevance, and evidence of generalization is often weak.
Three practical consequences follow.
- Contamination inflates scores. When benchmark tasks leak into training data, a model can look stronger than it is on unseen work. The same academic analysis describes this as a reason leaderboard numbers can be non-representative.
- Construct validity is uneven. Stanford researchers argue that benchmarks do not always measure what they claim and that the field should apply measurement science and psychometrics when assessing them. A high score on a reasoning suite is evidence about that suite.
- Serving conditions are not part of the score. The same model weights can behave differently depending on where and how they are served, which the next sections quantify.
The sensible reading of a public leaderboard is therefore a filter: it removes models that are clearly outside your quality or price range and leaves three to six candidates worth testing.
The same model can score differently on different endpoints
Teams often treat a model name as a fixed quantity. Measurements say otherwise. A 2026 study of 78 endpoints serving 12 model families found that identical models on different endpoints varied by up to 12.5 points in mean accuracy on math and code, and that tail latency could differ by an order of magnitude.
That study, Token Arena, measures inference at endpoint granularity across five axes: output speed, time to first token, workload-blended price, effective context, and live-endpoint quality. Its authors describe it as a methodology rather than a single ranking, and as no substitute for capability benchmarks. Two lessons carry over to your own testing:
- Benchmark the endpoint you will actually call, not the model family in the abstract.
- Treat quantization, context limits, and provider-side serving choices as variables that can move quality and latency, not as footnotes.
The same applies to model versions. A provider alias that silently points to a newer snapshot changes your baseline without any change on your side, which is why version pinning appears in the reproducibility checklist below.
Build an evaluation set that represents production
The most valuable asset in a benchmarking program is the task set. A practical guide to evaluating LLM-reliant systems proposes aligning the evaluation scope with the capabilities your system needs (grounding, tool use, reasoning) and mimicking production usage. It summarizes the dataset requirements as the "5 D's":
| Principle | What it means in practice |
|---|---|
| Defined | Every task maps to a capability and use case that is in scope for the product |
| Demonstrative | Inputs resemble real production requests, including their messiness |
| Diverse | The set covers easy, typical, and edge cases across the problem space |
| Decontaminated | Tasks are distinct from any data the models may have trained on |
| Dynamic | The set changes as the application and its failure modes change |
The authors also advocate treating evaluation datasets as living bodies of work that evolve with the application, to avoid the decay of metrics over time. A set frozen at launch will gradually stop reflecting what users ask.
A workable starting recipe
- Sample 50 to 200 real requests or tickets from logs, with personal data removed.
- Write an expected outcome for each: an exact answer, a rubric, a test that must pass, or a state the system must reach.
- Label each task by capability (extraction, code change, multi-step tool use) so results can be sliced.
- Hold back a subset that is never used for prompt tuning, so you can detect overfitting to your own set.
- Add every production failure to the set as a regression case.
For teams that want a deeper walkthrough of selecting a model from such a set, our guide to model evals for picking the best model covers the selection step in more detail.
Choose metrics that cover quality, speed, cost, and reliability
One number is never enough. A balanced comparison reports at least the following, per task slice.
| Dimension | Typical metrics | Common trap |
|---|---|---|
| Quality | Pass rate, rubric score, exact match, human preference | Scoring only the average and ignoring the worst slices |
| Latency | Time to first token, time between tokens, end-to-end p50, p90, p99 | Reporting mean latency only |
| Throughput | Requests or tokens per second at a given concurrency | Gains that come with unacceptable tail latency |
| Cost | Dollars per task, dollars per correct answer | Comparing list price per token without your input-to-output mix |
| Reliability | Error rate, timeouts, retries, refusal rate | Ignoring failures because they have no score |
| Safety | Policy violations, unsafe tool calls, data leakage | Testing only on benign inputs |
Latency deserves special care. Researchers who reviewed LLM inference evaluations found that common anti-patterns, such as ignoring practical latency bounds like TTFT and TBT and choosing workloads that do not represent production, frequently lead to misleading conclusions. The same authors argue that evaluations can emphasize throughput gains achieved at unacceptably high tail latency, even when the product has interactive latency requirements. If a user is waiting, p99 matters more than the mean.
Why cost must be workload-weighted
Per-token price lists hide the effect of your traffic shape. In the Token Arena work, workload-aware blended pricing can reorder leaderboards: a chat preset with a 3:1 input-to-output mix favors different endpoints than a retrieval-augmented preset with a 20:1 mix. The practical metric is cost per correct answer or cost per completed task, computed from your own token counts. A cheaper model that requires too many retries may lose its cost advantage.
Make the benchmark fair and reproducible
A benchmark that cannot be repeated is an anecdote. Reproducibility in LLM work is bounded rather than absolute, because hosted models can return different outputs for identical inputs. The goal is to control what you can and measure the variance that remains. A checklist that holds up in practice:
- Pin model versions. Use dated snapshots rather than moving aliases, and record the exact identifier in every result row.
- Fix sampling parameters. Use the same temperature, top-p, maximum output tokens, and stop sequences for every candidate where the model supports them, and document any differences. Where a provider exposes a seed, set it, while remembering that it does not guarantee identical outputs.
- Repeat runs. Run each task several times and report the mean and the spread. Differences smaller than the run-to-run noise are not findings.
- Use identical prompts and tooling. If one candidate receives a hand-tuned prompt and another a default one, you are benchmarking your effort, not the models. Where models need different prompt formats, tune each with the same budget of effort.
- Run candidates in the same time window. Provider load changes latency across the day, so interleave runs instead of testing one model in the morning and another at night.
- Keep the judge stable. If a model grades outputs, fix the judge model and rubric, spot-check its verdicts against human labels, and avoid grading a model with itself.
- Log everything. Store prompts, responses, token usage, latency, cost, and tool calls so a surprising result can be audited.
The cost of ignoring these steps is not theoretical: with endpoints varying by double-digit accuracy points for the same model name, an unpinned test can produce a ranking that does not survive the next run.
Benchmarking agents is different from benchmarking models
A bare model answers a prompt. An agent plans, calls tools, reads and writes files, recovers from errors, and decides when it is done. Its result depends on the model and on the harness that supplies tools, context management, and execution limits. We explain this effect in why the same AI model feels different in different products.
This changes what you test:
- Task completion, not text quality. The unit of evaluation is whether the end state is correct: tests pass, the record was updated, the file was produced.
- Trajectories matter. Two runs can reach the same answer with very different step counts, tool errors, and cost. Log the whole trajectory.
- The execution framework is a variable. The GTA-2 benchmark uses a recursive checkpoint-based evaluation mechanism that decomposes open-ended agent workflows into verifiable sub-goals, so that model and execution framework performance can be assessed together.
- More agents are not automatically better. The BenchAgent study normalizes benchmark loading, tool access, answer contracts, usage accounting, and trajectory logging, and reports that multi-agent systems do not consistently outperform matched single-agent workflows. Benchmark the simple configuration first.
The design principle in both is normalization: give every candidate the same tool access, the same answer contract, and the same accounting, then compare. Without it, a difference in score may come from a difference in plumbing.
For a worked example of a same-task comparison, see our Codex versus Claude Code benchmark on product APIs, and for a task-by-task view, best AI coding agents ranked by task and evidence.
Where HarnessRouter fits in the workflow
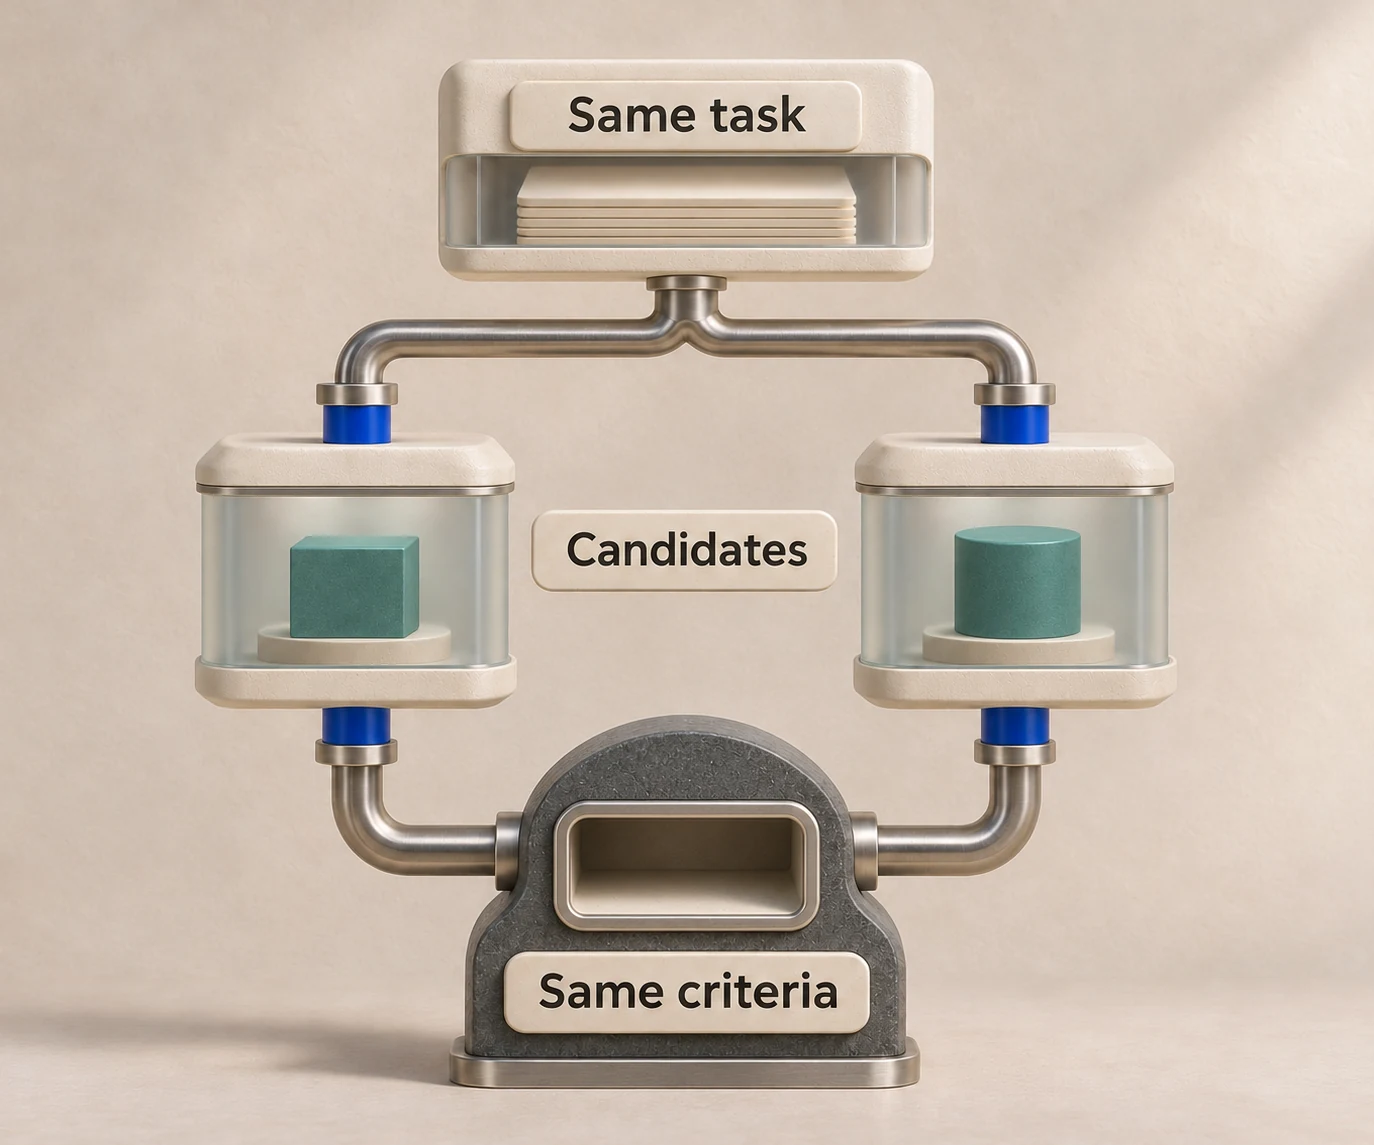
The usual obstacle to agent benchmarking is engineering effort. Each harness has its own session model, file handling, plugin conventions, and runtime requirements, so a fair comparison across several means writing and maintaining several integrations. HarnessRouter exposes supported agent harnesses, including Codex, Claude Code, Hermes, DeepSeek, and Pi, through one Agent API, so the same task can be sent to different harness and model pairs without separate agent backends. Those harnesses can then be compared on quality and pricing before one is committed to production.
The platform comes in two forms. The Community Edition is the open-source, self-hosted interface. The cloud platform adds managed runtime features such as session management, environment provisioning, and tracing, with published plans on the pricing page: Free at $0 per month, Developer at $20 per month, Production at $200 per month, and Scale at $1,000 per month, plus an Enterprise tier without a published price. Tracing is listed at $50 per month, and bring-your-own-key routing is fee-free up to $25,000 per month of model usage at listed prices, with a 5% routing fee above that volume. Model provider costs are passed through without markup.

To run your first same-task comparison, start from the [HarnessRouter landing page](/) or browse agent product examples to see how teams structure their integrations.
Interpreting results and acting on them
A finished run produces a table. Reading it well takes a few habits.
Slice before you average
A model that wins overall can lose badly on the one task category your customers care about. Report results per capability label and per difficulty band, and look for the slice where the leader's advantage disappears.
Compare on a frontier, not a rank
Plot quality against cost per task and against p95 latency. Models on the frontier are the only real options; anything dominated by a cheaper, better candidate can be dropped. Often the answer is not one model but a policy: a smaller model for routine requests and a stronger one for hard cases. That is the idea behind routing, explained in our guide to what an LLM router is.
Check infrastructure levers separately
Some savings come from how you serve, not what you serve. SkyServe, a 2024 system for serving across regions and clouds, reports P50, P90, and P99 latency improvements of up to 2.6x, 3.1x, and 2.7x, and cost reductions of up to 44% by managing spot instances across regions and clouds. That is a result for self-managed serving, and it applies if you operate your own inference rather than call hosted endpoints. Keep infrastructure experiments apart from model comparisons so the effects are not confused.
Re-run on a schedule
Models, endpoints, and prices change. Re-run the suite when a provider ships a new version, when your traffic mix shifts, and on a fixed cadence, and keep results in version control so trends are visible. For coding agents specifically, cost behavior is worth tracking over time, as covered in why Claude Code gets expensive.
Our perspective: benchmark the system, not the model name
We build infrastructure that lets teams run many agent harnesses behind one interface, and the pattern we see most often is that teams compare model names while the larger variance sits in the layer around them. The same model with a different harness, tool set, or session strategy can produce a different completion rate and a different bill. For that reason we think the correct unit of comparison for an agent product is the harness and model pair, run under identical task contracts.
We also think benchmarks should be cheap to repeat. If a comparison needs a new integration for every candidate, teams run it once, at launch, and never again, which is exactly when results decay. A unified API, open standards such as the Unified Harness Protocol, and an open-source edition that can be self-hosted are meant to lower that cost, so that re-running a suite after a model release becomes routine. Our overview of agent protocols in 2026 describes where the standards stand.
Finally, we would rather a team trust a small, honest, regularly refreshed task set than a large public score. Your own failures are the most representative data you have.
FAQ
How do I benchmark AI models for my own use case?
Start with 50 to 200 real, production-like tasks with expected outcomes, then run two to five shortlisted models under identical prompts, tools, and sampling settings. Score quality, p95 latency, and cost per completed task, and repeat each run several times to measure noise. Slice the results by task type before deciding.
Are public leaderboards reliable for choosing a model?
They are useful for narrowing the field, but research shows scores may not predict real-world competence because of contamination, weak task relevance, and limited evidence of generalization. Treat a leaderboard position as a hypothesis and confirm it on your own data.
Which metrics matter most?
It depends on the product, but a minimal set is task success rate, tail latency (p95 or p99), and cost per correct answer. Add reliability and safety measures for anything that takes actions on a user's behalf. Mean latency alone can hide the delays users actually notice.
How is agent benchmarking different from model benchmarking?
Agents are judged on whether they complete a task end to end, including tool calls and recovery from errors, so the harness is part of the system under test. Normalize tool access, answer format, and logging across candidates, and record full trajectories to understand cost and failure modes.
How often should I re-run a benchmark?
Re-run whenever a provider releases a new model version, when your traffic or prompts change, and on a regular schedule such as monthly or quarterly. Keep the task set updated with new production failures so it stays representative.
Sources
- Line Goes Up? Inherent Limitations of Benchmarks for Evaluating Large Language Models
- The Tests That Grade AI May Be Getting It Wrong, Stanford HAI
- A Practical Guide for Evaluating LLMs and LLM-Reliant Systems
- On Evaluating Performance of LLM Inference Serving Systems
- Token Arena: A Continuous Benchmark Unifying Energy and Quality
- Do More Agents Help? Controlled and Normalized Comparison (BenchAgent)
- GTA-2: Benchmarking Tool Agents
- SkyServe: Serving AI Models across Regions and Clouds